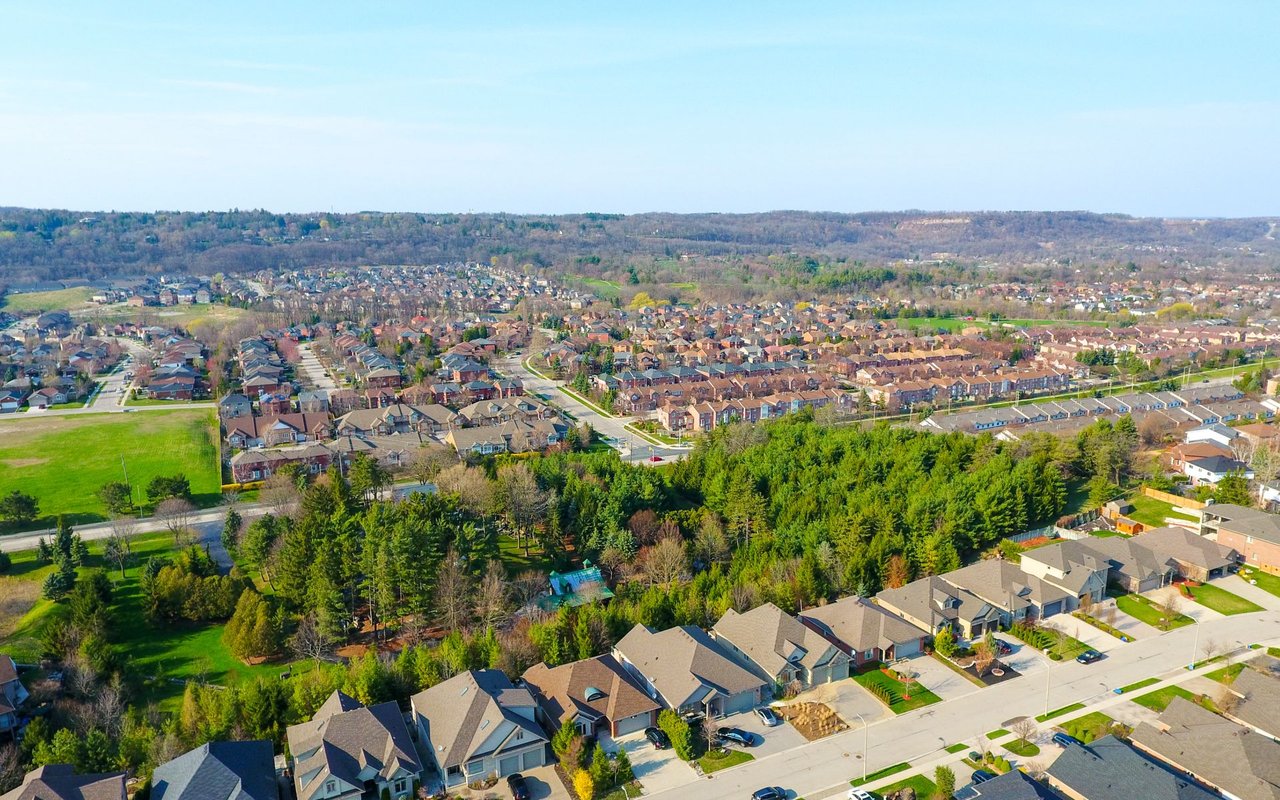
3,115 people live in Kirkendall & Durand, where the median age is 43 and the average individual income is $162,375. Data provided by Statistics Canada.
Total Population
Median Age
Population Density Population Density This is the number of people per square mile in a neighborhood.
Average individual Income
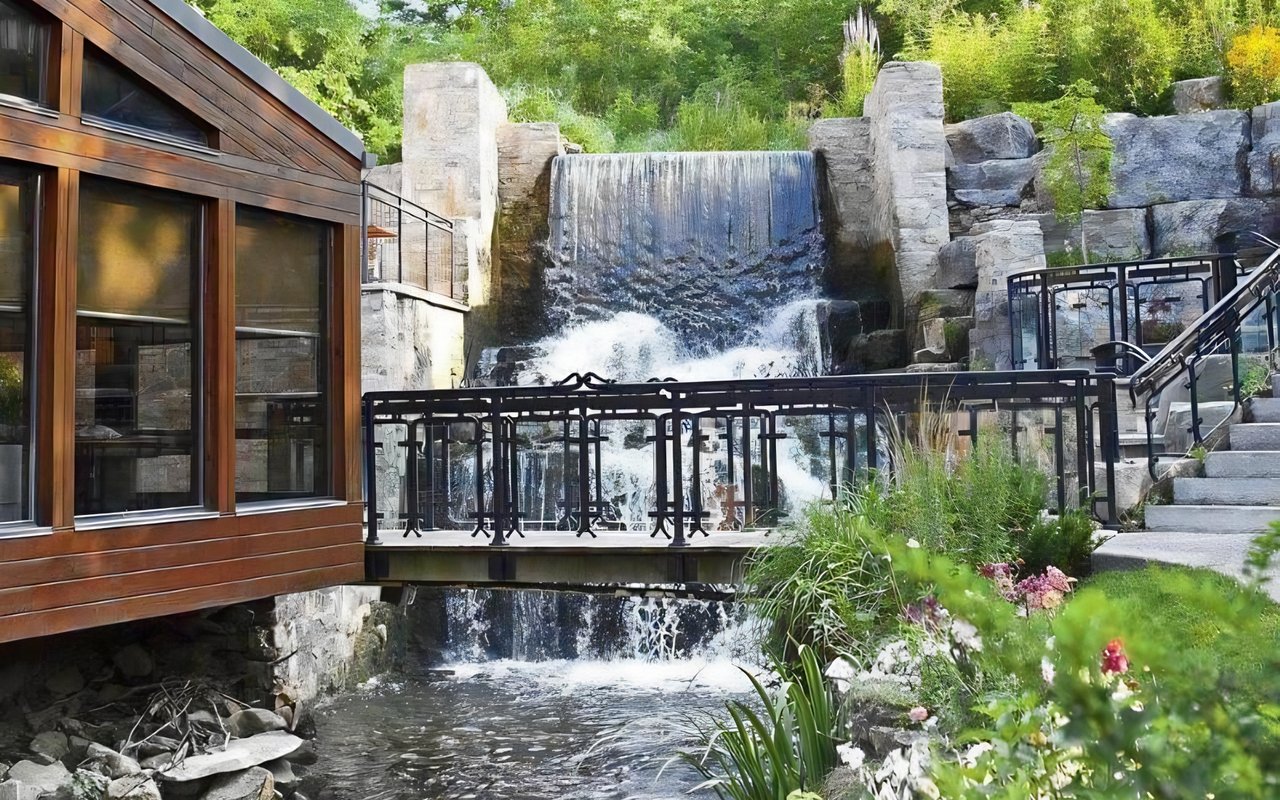
There's plenty to do around Kirkendall & Durand, including shopping, dining, nightlife, parks, and more. Data provided by Walk Score and Yelp.
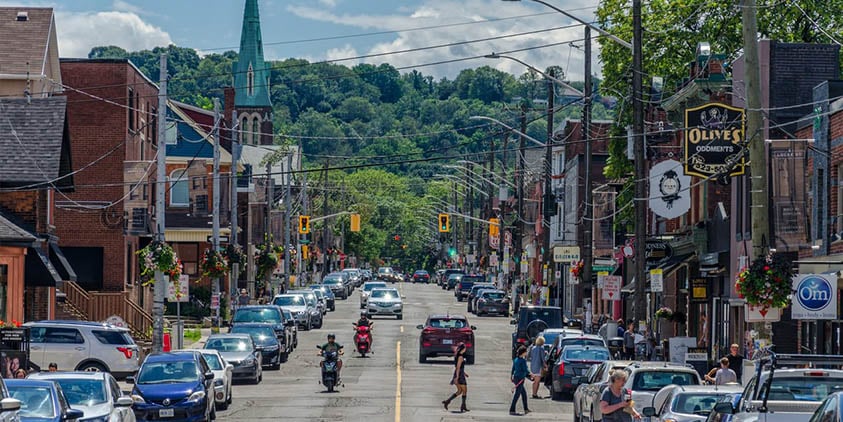
Explore popular things to do in the area, including Mystic Ramen, Domino's Pizza, and CUMBRAE'S.
| Name | Category | Distance | Reviews |
Ratings by
Yelp
|
|---|---|---|---|---|
| Dining | 1.46 miles | 13 reviews | 5/5 stars | |
| Dining | 3.19 miles | 5 reviews | 5/5 stars | |
| Dining · $$$ | 3.4 miles | 5 reviews | 5/5 stars | |
| Dining | 1.62 miles | 5 reviews | 5/5 stars | |
| Dining | 1.53 miles | 5 reviews | 5/5 stars | |
| Dining | 1.48 miles | 5 reviews | 5/5 stars | |
| Dining | 1.14 miles | 12 reviews | 5/5 stars | |
| Dining | 1.39 miles | 5 reviews | 5/5 stars | |
| Dining | 1.2 miles | 12 reviews | 4.9/5 stars | |
| Dining | 3.84 miles | 11 reviews | 4.9/5 stars | |
| Dining · $ | 1.22 miles | 8 reviews | 4.9/5 stars | |
| Dining | 3.78 miles | 8 reviews | 4.9/5 stars | |
| Dining | 1.05 miles | 7 reviews | 4.9/5 stars | |
| Dining | 1.74 miles | 6 reviews | 4.8/5 stars | |
| Dining | 3.52 miles | 6 reviews | 4.8/5 stars | |
| Dining | 3.57 miles | 17 reviews | 4.8/5 stars | |
| Dining | 0.36 miles | 5 reviews | 4.8/5 stars | |
| Beauty | 0.4 miles | 7 reviews | 5/5 stars | |
| Beauty | 1.8 miles | 6 reviews | 5/5 stars | |
| Beauty | 1.59 miles | 7 reviews | 5/5 stars | |
| Beauty | 0.69 miles | 6 reviews | 5/5 stars | |
|
|
||||
|
|
||||
|
|
||||
|
|
||||
|
|
||||
|
|
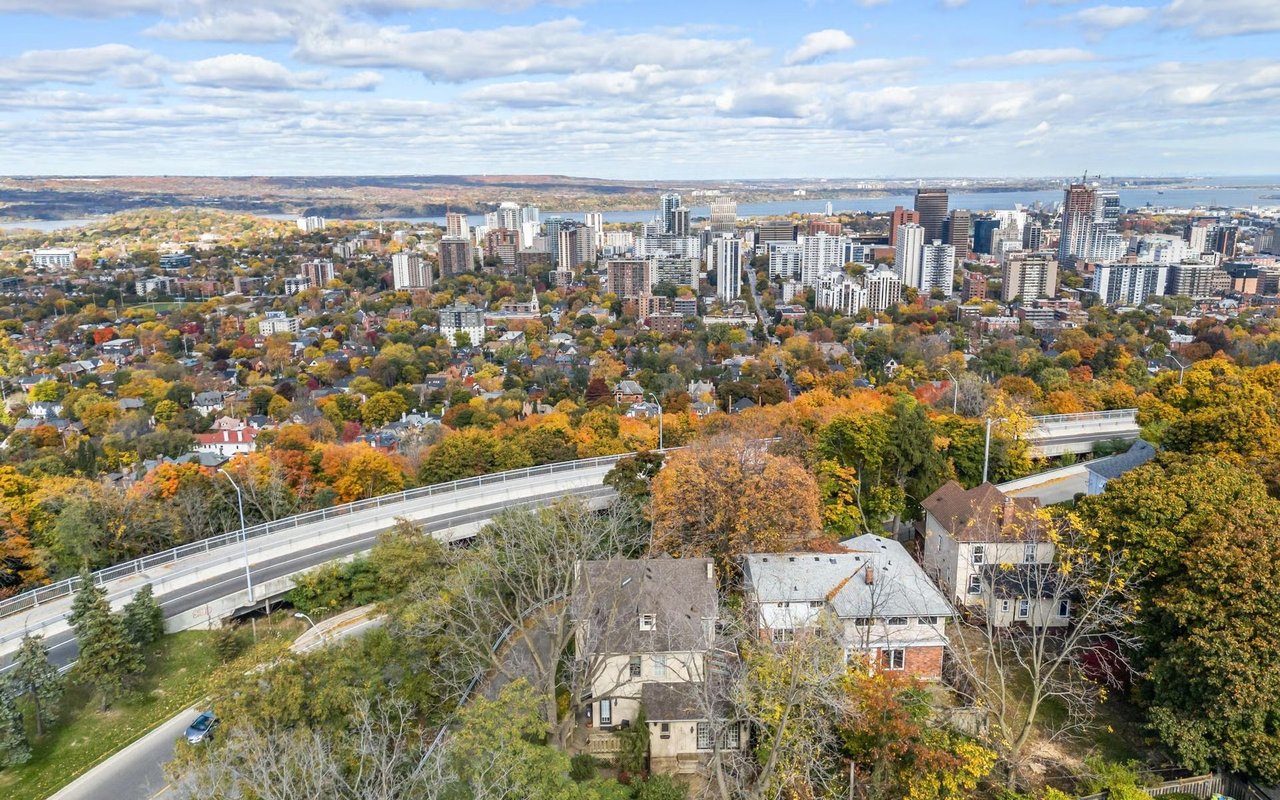
Kirkendall & Durand has 1,219 households, with an average household size of 3. Data provided by Statistics Canada. Here’s what the people living in Kirkendall & Durand do for work — and how long it takes them to get there. Data provided by Statistics Canada.
Total Population
Population Density Population Density This is the number of people per square mile in a neighborhood.
Median Age
Men vs Women
Population by Age Group
0-9 Years
10-17 Years
18-24 Years
25-64 Years
65-74 Years
75+ Years
Education Level
Total Households
Average Household Size
Average individual Income
Households with Children
With Children:
Without Children:
Marital Status
Blue vs White Collar Workers
Blue Collar:
White Collar:
Stella McCollum is passionate about enhancing your real estate experience through innovative marketing strategies, collaborative negotiations, and a deep commitment to your success — every step of the way.
Let's Connect